 Open Data Science Europe Metadata Catalog
land cover
Type of resources
Available actions
Topics
Keywords
Contact for the resource
Provided by
Years
Formats
Representation types
Update frequencies
status
Resolution
-

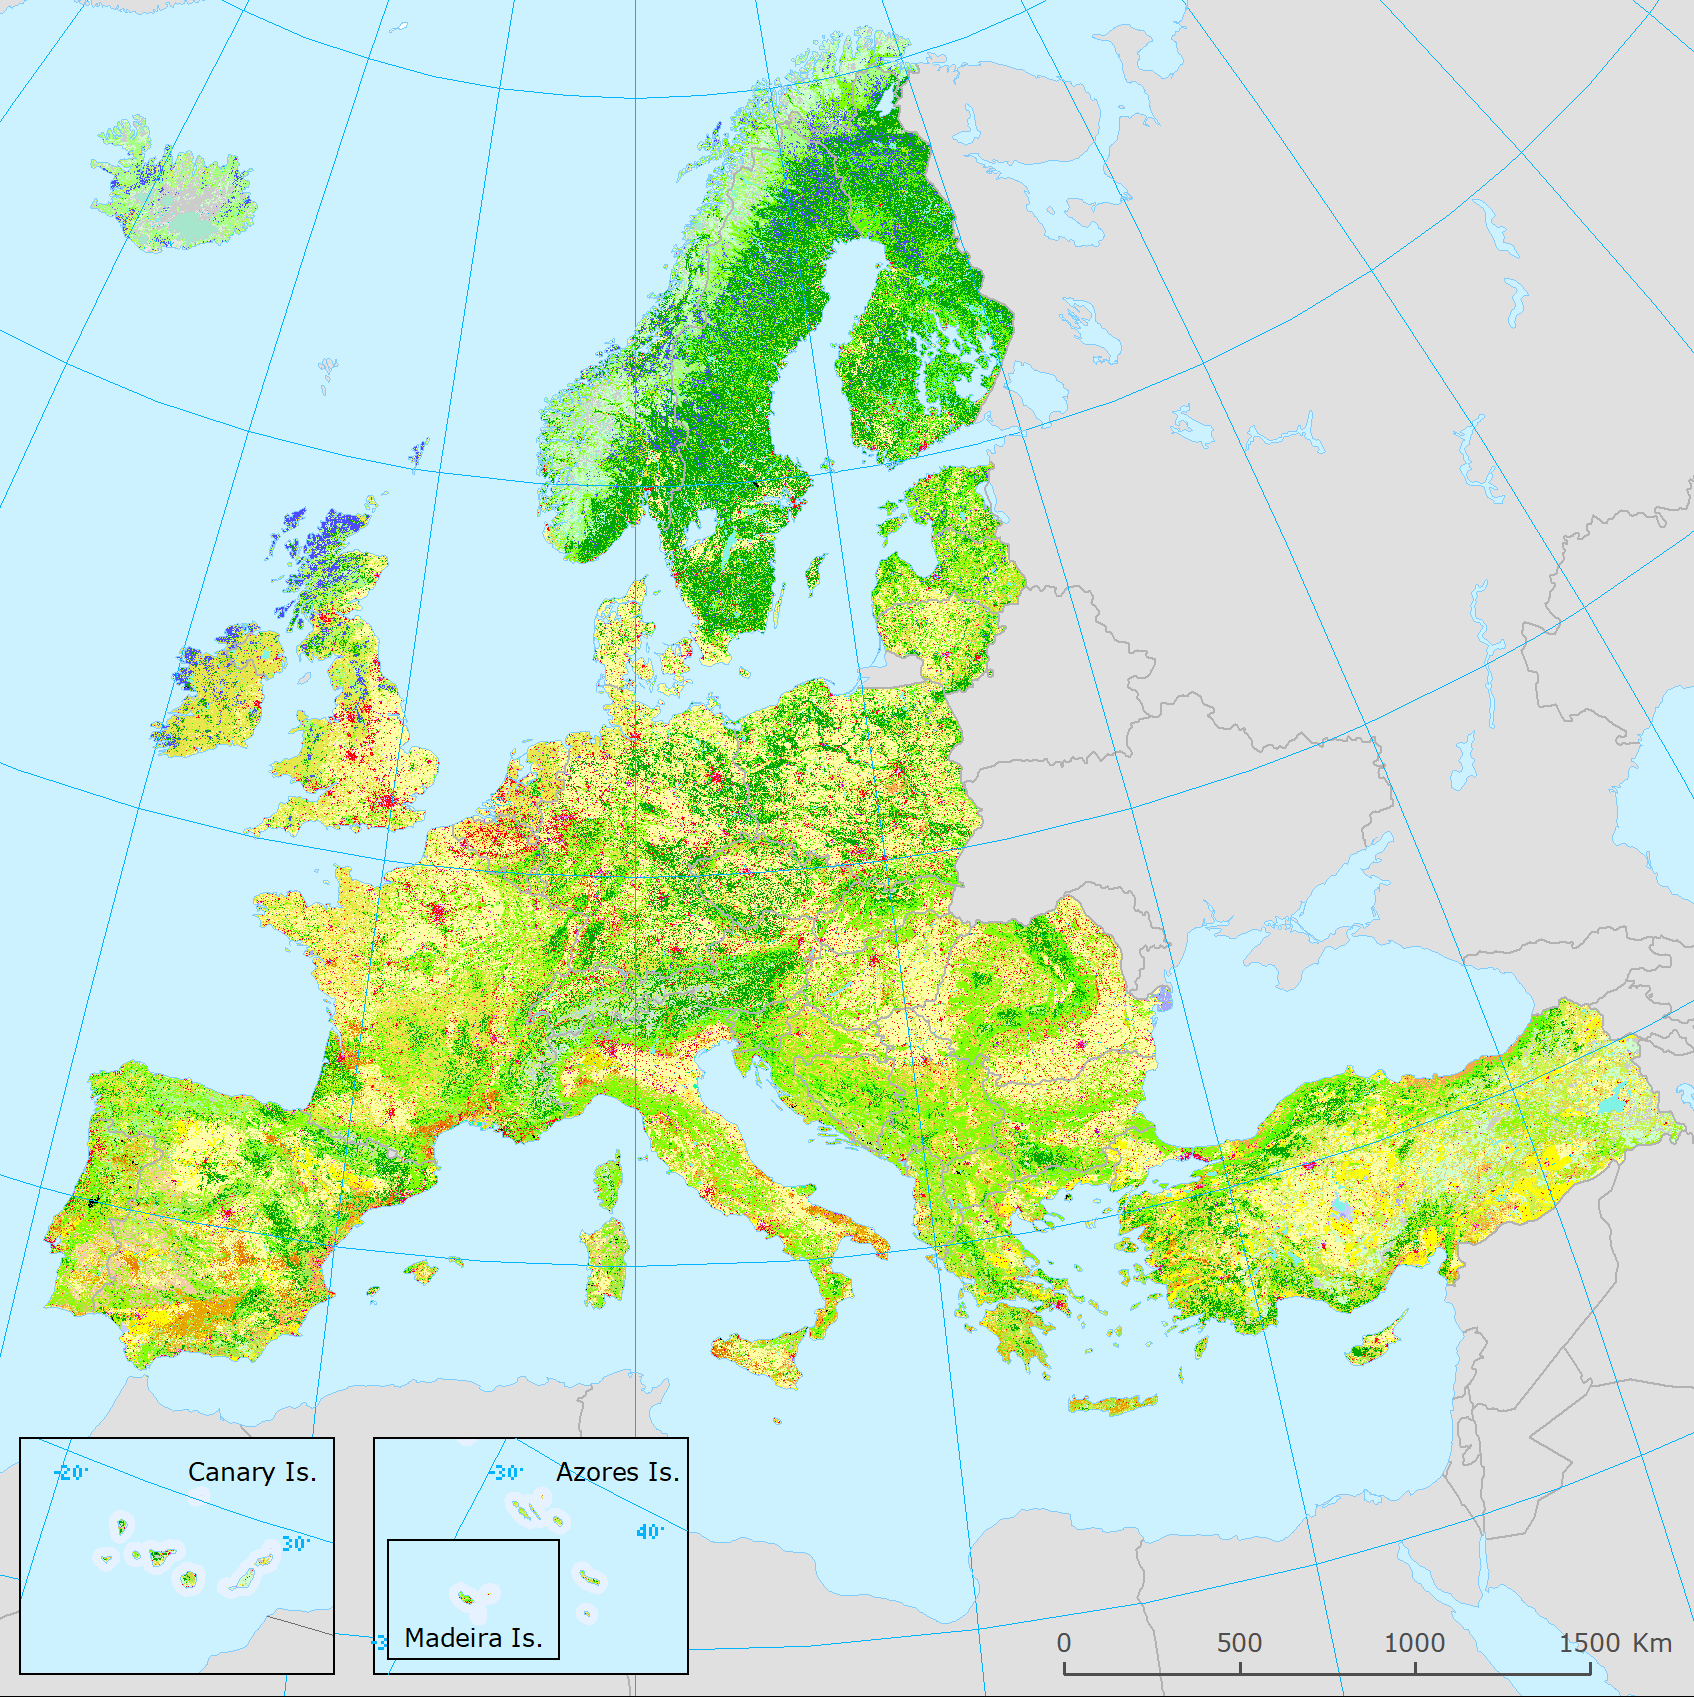
The Land Cover Map of Europe 2017 is a product resulting from the Phase 2 of the S2GLC project. The final map has been produced on the CREODIAS platform with algorithms and software developed by CBK PAN. Classification of over 15 000 Sentinel-2 images required high level of automation that was assured by the developed software. The legend of the resulting Land Cover Map of Europe 2017 consists of 13 land cover classes. The pixel size of the map equals 10 m, which corresponds to the highest spatial resolution of Sentinel-2 imagery. Its overall accuracy was estimated to be at the level of 86% using approximately 52 000 validation samples distributed across Europe. Related publication: https://doi.org/10.3390/rs12213523
-

The free available dataset by the European Space Agency (ESA) contains the global landcover, which is divided into eleven classes: - Tree cover - Shrubland - Grassland - Cropland - Built-up - Bare/sparse vegetation - Snow and ice - Permanent water bodies - Herbaceous wetland - Mangroves - Moss and lichen. The landcover was originally derived from Sentinel-1 and Sentinel-2 data. There are 2651 tiles (3x3 degrees) at a spatial resolution of 10m, which can be downloaded as GeoTIFFs in the the EPSG:4326 projection (WGS84). For each tile there are two layers. One contains the land cover map and the other a three band GeoTIFF providing three per pixel quality indicators of the Sentinel-1 and Sentinel-2 input data.
-
The present 100m raster dataset is the 2018 CLC status layer modified for the purpose of consistent statistical analysis in the land cover change accounting system at EEA. CORINE Land Cover (CLC) data are produced from 1986 for European (EEA member or cooperating) countries. Altogether five mapping inventories were implemented in this period, producing five status layers (CLC1990, CLC2000, CLC2006, CLC2012, CLC2018) and four CLC-Change (CLCC) layers for the corresponding periods (1990-2000, 2000-2006, 2006-2012, 2012-2018). Pan-European CLC and CLCC data are available as vector and raster products. Due to the technical characteristics of CLC and CLCC data, the evolution in CLC update methodology and in quality of input data, time-series statistics derived directly from historical CLC data includes several inconsistencies. In order to create a statistically solid basis for CLC-based time series analysis, a harmonization methodology was elaborated.
-
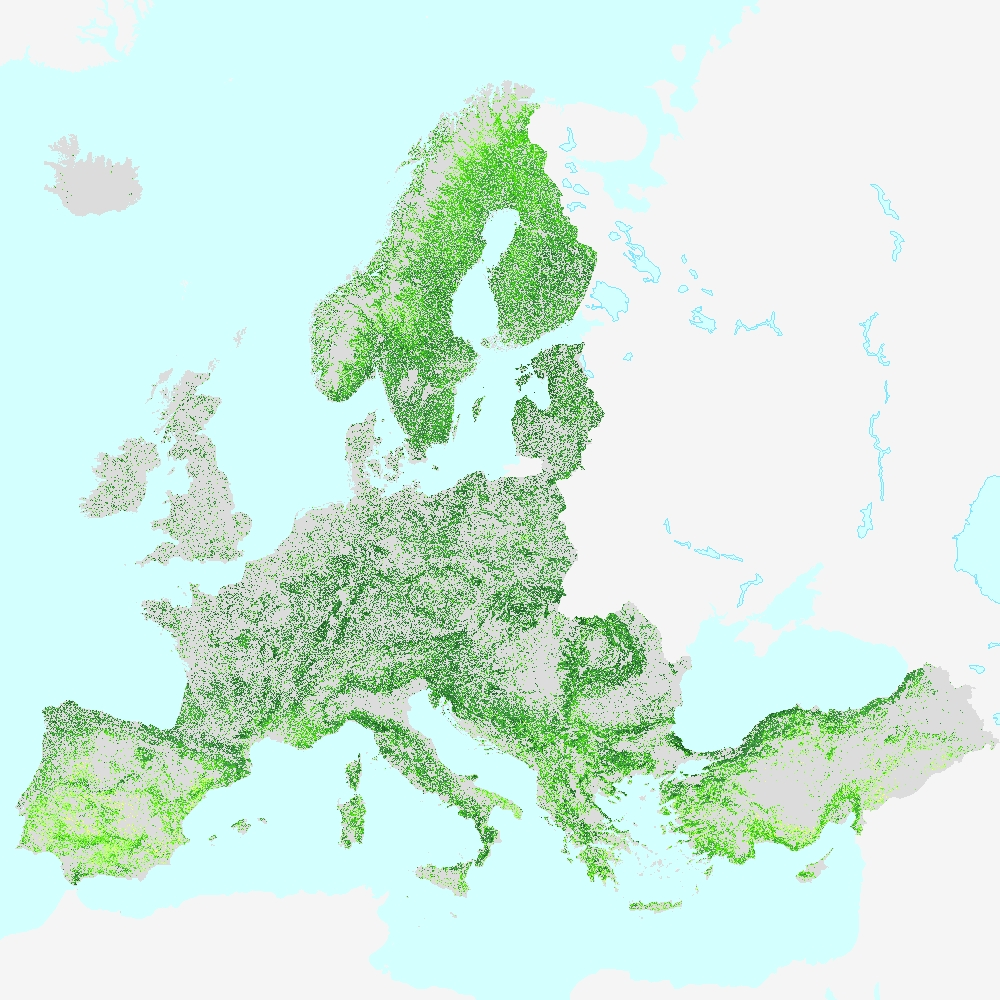
This metadata refers to the HRL Forest 2018 primary status layer Tree Cover Density (TCD). The TCD raster product provides information on the proportional crown coverage per pixel at 10m spatial resolution and ranges from 0% (all non-tree covered areas) to 100%, whereby Tree Cover Density is defined as the "vertical projection of tree crowns to a horizontal earth’s surface“. The production of the High Resolution Forest layers was coordinated by the European Environment Agency (EEA) in the frame of the EU Copernicus programme. The HRL Forest product consists of 3 types of (status) products and additional change products. The status products are available for 2012, 2015, and 2018 reference years: 1. Tree cover density (TCD) (level of tree cover density in a range from 0-100%) 2. Dominant leaf type (DLT) (broadleaved or coniferous majority) 3. Forest type product (FTY). The forest type product allows to get as close as possible to the FAO forest definition. In its original (10m (2018) / 20m (2012, 2015)) resolution it consists of two products: a dominant leaf type product that has a MMU of 0.5 ha, as well as a 10% tree cover density threshold applied, and 2) a support layer that maps (now only available on demand), based on the dominant leaf type product, trees under agricultural use and in urban context (derived from CLC and imperviousness 2009 data). For the final 100 m product trees under agricultural use and urban context from the support layer are removed. NEW for 2018: the 10m 2018 reference year FTY product now also has the agricultural/urban trees removed. In the past this was done only for the 100m product, now it is consistently applied for both the 10m and the 100m FTY products. This dataset is provided as 10 meter rasters (fully conformant with the EEA reference grid) in 100 x 100 km tiles grouped according to the EEA38 countries and the United Kingdom.